Please make sure you change the default passwords and usernames to keep things safe.
Where I have found documentation to do a step, I have referenced it, so if things don't work for you, go there, they have probably changed something (and hopefully their documentation too!)
If you have any suggestions for improvements, let me know by commenting on this post.
And in case you were wondering what's inside: https://fccid.io/SWX-UCKG2/Internal-Photos/Internal-Photos-3757624
This whole article was as a response to https://github.com/unifi-poller/unifi-poller/issues/172
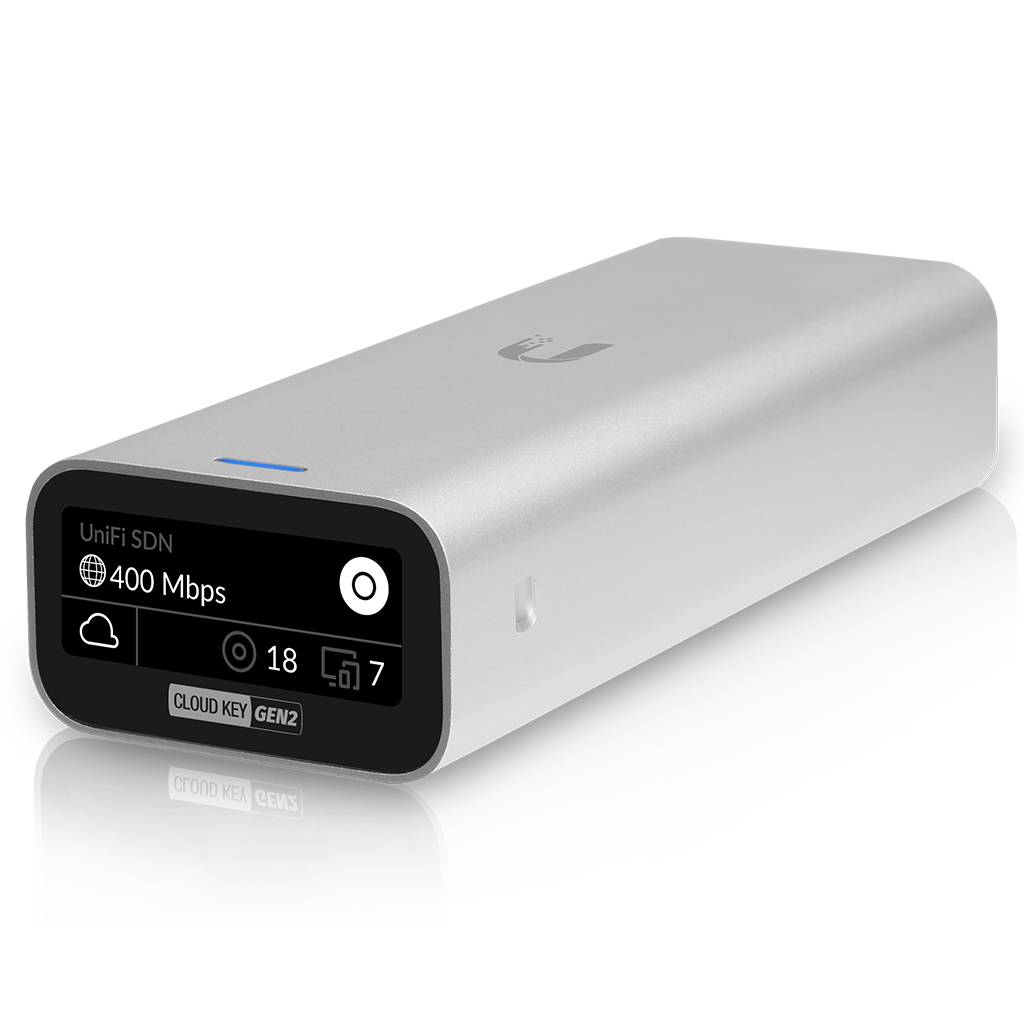
I am adding this picture, to make everything slightly more interesting:
Install Grafana (https://grafana.com/docs/grafana/latest/installation/debian/):
curl https://packages.grafana.com/gpg.key | sudo apt-key add -
apt install -y apt-transport-https
add-apt-repository "deb https://packages.grafana.com/oss/deb stable main"
apt -y update && sudo apt -y install grafana
systemctl daemon-reload
systemctl start grafana-server
systemctl enable grafana-server.service
systemctl status grafana-server
Install Influxdb (comes in Xenial):
apt-get update
apt-get install -y influxdb influxdb-client
Add user to influx (https://v2.docs.influxdata.com/v2.0/users/create-user/):
influx -host localhost -port 8086
CREATE DATABASE unifi
USE unifi
CREATE USER unifipoller WITH PASSWORD 'unifipoller' WITH ALL PRIVILEGES
GRANT ALL ON unifi TO unifipoller
Install unifi-poller (https://github.com/unifi-poller/unifi-poller/wiki/Installation#debian-variants-ubuntu-knoppix):
curl -s https://golift.io/gpgkey | sudo apt-key add -
echo deb https://dl.bintray.com/golift/ubuntu bionic main | sudo tee /etc/apt/sources.list.d/golift.list
apt update
apt install unifi-poller
Correct the unifi-poller configuration file (https://github.com/unifi-poller/unifi-poller/wiki/Installation#linux-post-install):
vi /etc/unifi-poller/up.conf
Go to the Grafana webpage http://controller-ip:3000 and login with admin/admin
Change your password for admin
Add an influxdb datasource (it should say it's connected)
Add dashboards by ID: https://github.com/unifi-poller/unifi-poller/wiki/Grafana#import-dashboards
Memory usage:
PID USER PR NI VIRT RES SHR S %CPU %MEM TIME+ COMMAND
988 unifi 20 0 6368724 405672 19228 S 32.6 20.0 3:29.76 java
911 unifi 20 0 3170348 74576 16972 S 0.0 3.7 0:10.08 launcher
1036 grafana 20 0 1654836 32816 17276 S 0.0 1.6 0:03.70 grafana-server
1170 unifi 20 0 1230256 101868 18208 S 5.6 5.0 0:32.71 mongod
758 root 20 0 933412 37248 13480 S 0.0 1.8 0:04.16 node
626 www-data 20 0 881340 42920 12276 S 0.0 2.1 0:02.81 node
761 nobody 20 0 715480 13712 5664 S 7.6 0.7 0:07.50 unifi-poller
754 influxdb 20 0 612316 94832 6944 S 5.9 4.7 0:25.09 influxd
784 root 20 0 530660 32420 13316 S 0.0 1.6 0:02.22 containerd
615 root 20 0 168552 12780 8820 S 3.9 0.6 0:23.99 ck-ui

Nice. I could convert your tutorial to my Ubuntu Server environment...
ReplyDeleteThanks for the tut...